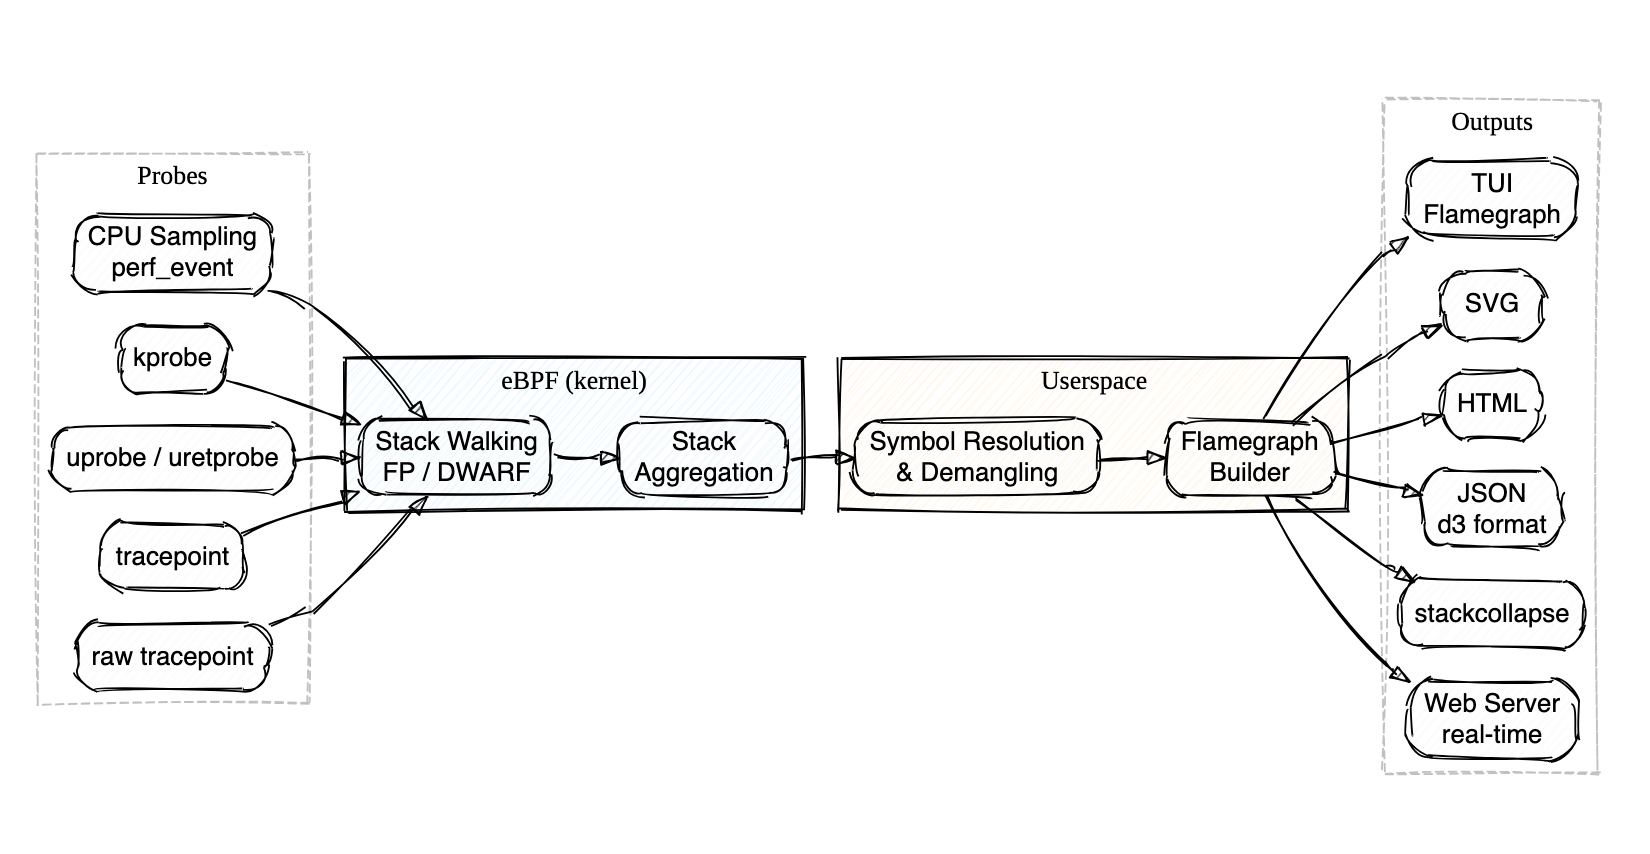
Profile Bee is an eBPF-based CPU profiler that ships as a single binary — no BCC, libbpf, or perf tooling needed on the target host. Built with Rust and aya.
- Just
cargo install,sudo probee --tui, and you're looking at a live flamegraph — no package manager dance, no Python dependencies, no separate visualization step - Walks stacks directly in the kernel via frame pointers (fast, the default) or DWARF unwind tables (for those
-O2binaries everyone ships without frame pointers) - Attaches to perf events, kprobes, uprobes, or tracepoints — auto-discovers uprobe targets with glob and regex matching
- Demangles Rust and C++ symbols out of the box
- Outputs to interactive TUI, SVG, HTML, JSON, stackcollapse, pprof, or a real-time web server — whatever fits your workflow
- Uploads profiles directly to AWS CodeGuru Profiler for continuous profiling in the cloud
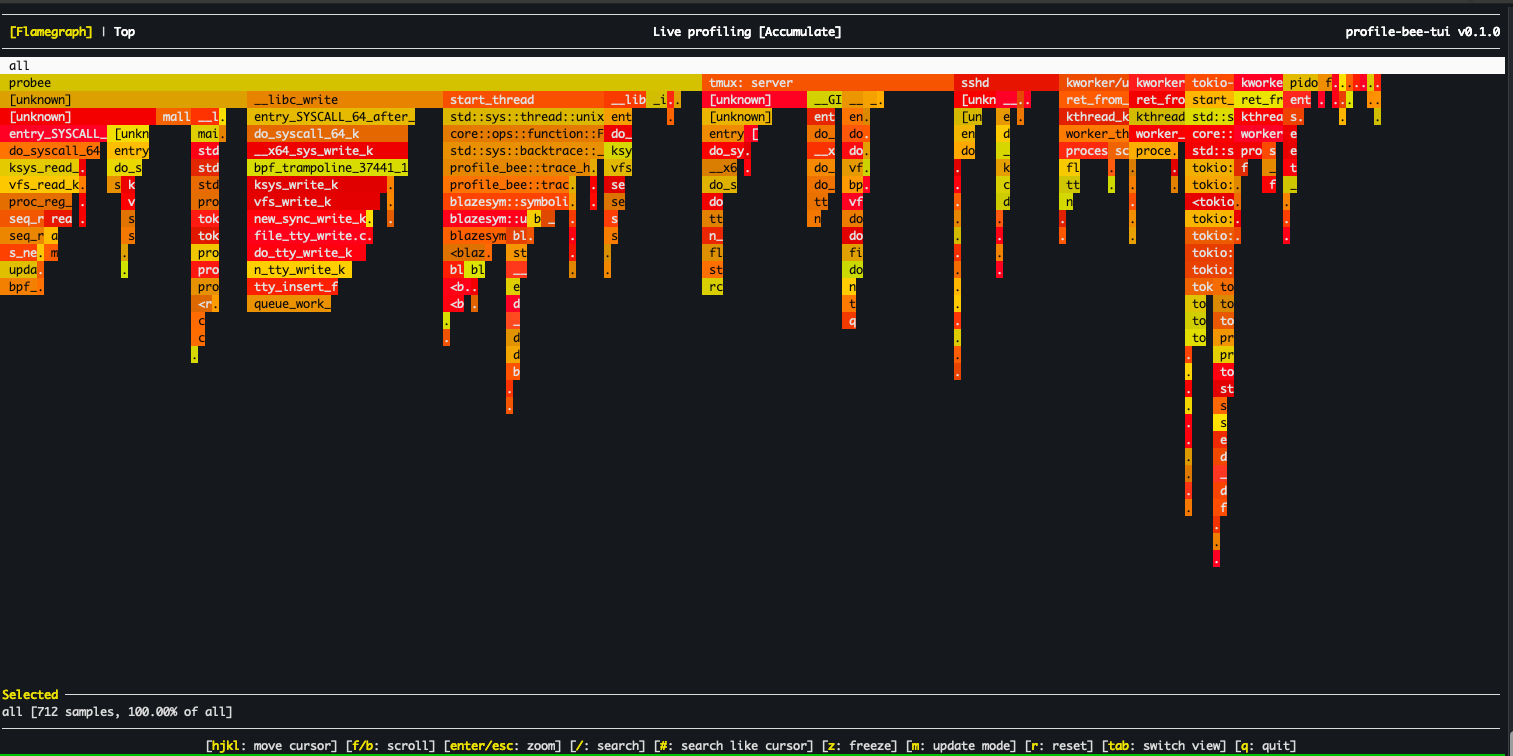
Real-time TUI flamegraphs
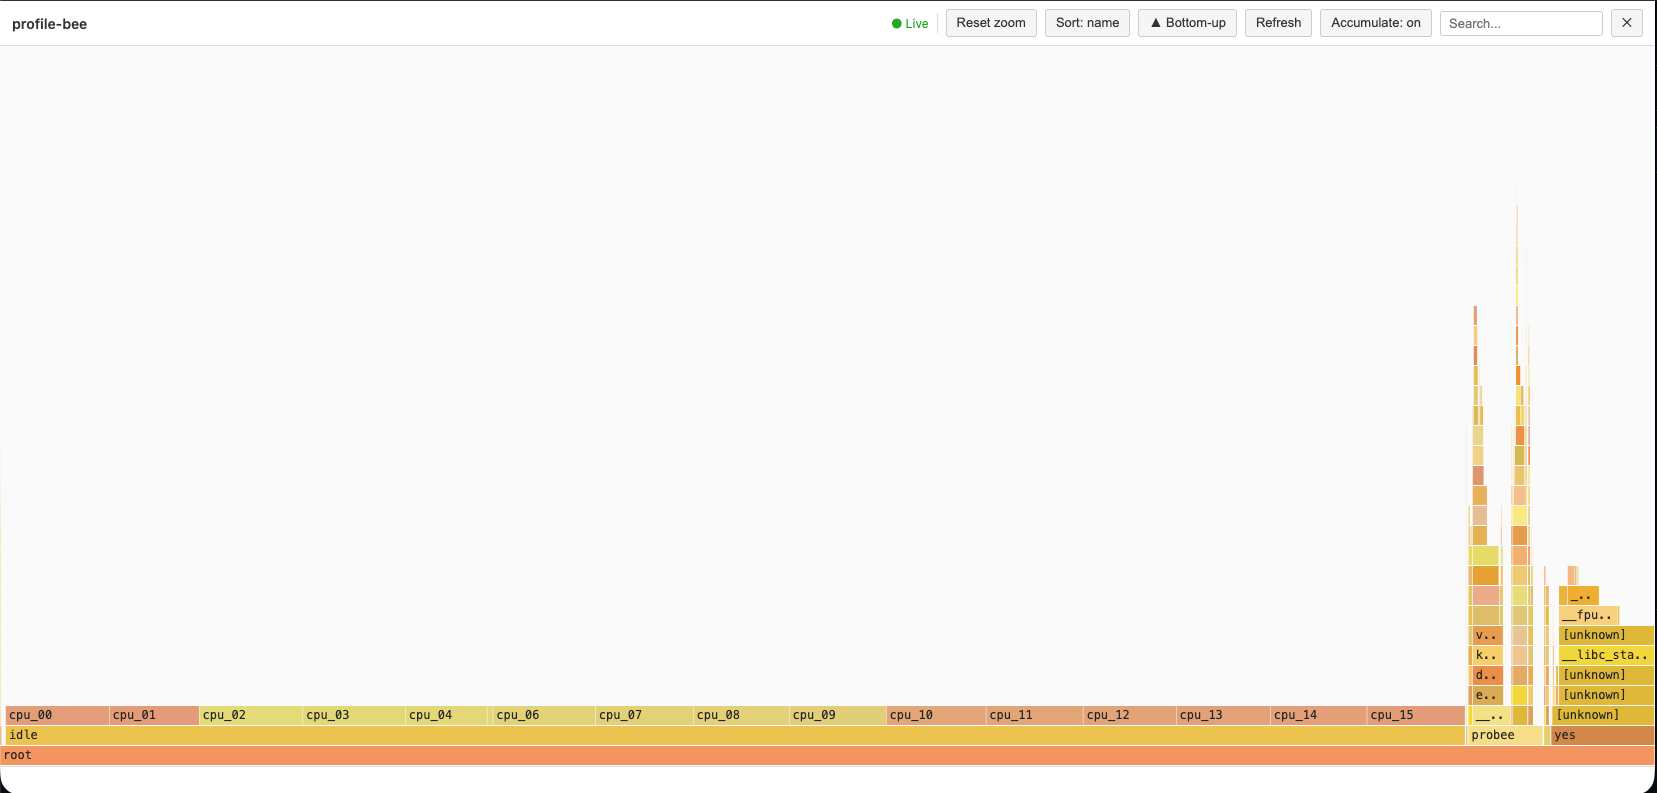
Real-time Web-based flamegraphs
Download and install the latest release with a single command:
curl -fsSL https://raw.githubusercontent.com/zz85/profile-bee/main/install.sh | bashOr with wget:
wget -qO- https://raw.githubusercontent.com/zz85/profile-bee/main/install.sh | bashThis installs pre-built binaries to ~/.local/bin. No Rust toolchain required.
cargo install profile-beeInstalls probee and pbee (short alias). No nightly Rust required — a prebuilt eBPF binary is bundled. Requires root to run (eBPF).
# Interactive TUI flamegraph (live, system-wide)
sudo probee --tui

# Profile a specific command
sudo probee --tui --cmd "my-application"

# Generate an SVG flamegraph
sudo probee --svg flamegraph.svg --time 5000

# Profile a command with args
sudo probee --svg output.svg -- ./my-binary arg1 arg2

# Real-time flamegraphs via web server
sudo probee --serve --skip-idle

# Trace function calls with uprobe
sudo probee --uprobe malloc --time 1000 --svg malloc.svg

# Off-CPU profiling — find where threads block
sudo probee --off-cpu --tui -- ./my-server
Run probee with no arguments or probee --help for the full list of options and examples.
- Interactive TUI — real-time flamegraph viewer with vim-style navigation, search, zoom, and mouse support (click, scroll, double-click to zoom)
- Off-CPU profiling (
--off-cpu) — trace context switches viafinish_task_switchkprobe to find where threads block on I/O, locks, or sleep. Configurable block-time filters. - Multiple output formats — SVG, HTML, JSON (d3), stackcollapse, and pprof protobuf (
.pb.gz) - AWS CodeGuru integration (
--codeguru-upload) — upload profiles directly to AWS CodeGuru Profiler with proper thread-state counter types (RUNNABLE/WAITING) - Frame pointer unwinding (default) — fast eBPF-based stack walking via
bpf_get_stackid - DWARF unwinding (
--dwarf) — profiles-O2/-O3binaries without frame pointers using.eh_frametables loaded into eBPF maps - Smart uprobes — GDB-style symbol resolution with glob, regex, demangled name matching, and multi-attach
- kprobe & tracepoint support — profile kernel functions and tracepoint events
- Real-time web server (
--serve) — live flamegraph updates over HTTP with interactive controls - Automatic termination — stops when
--pidtarget or--cmdprocess exits - Rust & C++ demangling — via gimli/blazesym
- BPF-based aggregation — stack counting in kernel to reduce userspace data transfer
- Group by CPU / process — per-core or per-PID flamegraph breakdown (
--group-by-cpu,--group-by-process) - Process lifecycle tracking — eBPF-driven exec and exit detection via
sched_process_exec/sched_process_exittracepoints. Auto-enabled with DWARF unwinding; available to library consumers viaSessionConfig::track_process_lifecycle - Process metadata cache — lazy per-PID cache of
cmdline,cwd,environ,exe, and mount namespace. Library API for agents that need to enrich profiling data with process context
# SVG flamegraph
sudo probee --svg profile.svg --frequency 999 --time 5000

# HTML flamegraph
sudo probee --time 5000 --html flamegraphs.html

# Stackcollapse format (compatible with speedscope, flamegraph.pl)
sudo probee --collapse profile.txt --frequency 999 --time 10000

# pprof protobuf (compatible with go tool pprof, Grafana/Pyroscope, Speedscope)
sudo probee --pprof profile.pb.gz --time 5000

# AWS CodeGuru Profiler JSON (uploadable via AWS CLI)
sudo probee --codeguru profile.json --time 5000

# All output formats at once
sudo probee --time 5000 --html out.html --json out.json --collapse out.txt --svg out.svg --pprof out.pb.gz

# Grouped by CPU
sudo probee --svg profile.svg --frequency 999 --time 2000 --group-by-cpu

# Grouped by process (each PID gets its own flamegraph sub-tree)
sudo probee --svg profile.svg --time 5000 --group-by-process# Profile specific PID (auto-stops when process exits)
sudo probee --pid <pid> --svg output.svg --time 10000
# Profile specific CPU core
sudo probee --cpu 0 --svg output.svg --time 5000
# Profile a command
sudo probee --svg output.svg -- ./my-binary arg1 arg2
# Real-time flamegraphs via web server
sudo probee --time 5000 --serve --skip-idle --stream-mode 1
# Then open http://localhost:8000/ and click "realtime-updates"# Profile kernel function calls
sudo probee --kprobe vfs_write --time 200 --svg kprobe.svg
# Profile tracepoint events
sudo probee --tracepoint tcp:tcp_probe --time 200 --svg tracepoint.svgProfile-bee supports GDB-style symbol resolution for uprobes. Instead of manually specifying which library a function lives in, you provide a probe spec and the tool auto-discovers matching symbols across all loaded ELF binaries.
# Auto-discover library
sudo probee --uprobe malloc --time 1000 --svg malloc.svg

# Multiple probes at once
sudo probee --uprobe malloc --uprobe 'ret:free' --time 1000 --svg alloc.svg

# Glob matching — trace all pthread functions
sudo probee --uprobe 'pthread_*' --time 1000 --svg pthread.svg

# Regex matching
sudo probee --uprobe '/^sql_.*query/' --pid 1234 --time 2000 --svg sql.svg

# Demangled C++/Rust name matching
sudo probee --uprobe 'std::vector::push_back' --pid 1234 --time 1000 --svg vec.svg

# Source file and line number (requires DWARF debug info)
sudo probee --uprobe 'main.c:42' --pid 1234 --time 1000 --svg source.svg

# Explicit library prefix
sudo probee --uprobe libc:malloc --time 1000 --svg malloc.svg

# Absolute path to binary
sudo probee --uprobe '/usr/lib/libc.so.6:malloc' --time 1000 --svg malloc.svg

# Return probe (uretprobe)
sudo probee --uprobe ret:malloc --time 1000 --svg malloc_ret.svg

# Function with offset
sudo probee --uprobe malloc+0x10 --time 1000 --svg malloc_offset.svg

# Scope to a specific PID
sudo probee --uprobe malloc --uprobe-pid 12345 --time 1000 --svg malloc_pid.svg

# Discovery mode — list matching symbols without attaching
sudo probee --list-probes 'pthread_*' --pid 1234
Probe spec syntax:
| Syntax | Example | Description |
|---|---|---|
function |
malloc |
Exact match, auto-discover library |
lib:function |
libc:malloc |
Explicit library name prefix |
/path:function |
/usr/lib/libc.so.6:malloc |
Absolute path prefix |
ret:function |
ret:malloc |
Return probe (uretprobe) |
function+offset |
malloc+0x10 |
Function with byte offset |
glob_pattern |
pthread_* |
Glob matching (*, ?, [...]) |
/regex/ |
/^sql_.*query/ |
Regex matching |
Namespace::func |
std::vector::push_back |
Demangled C++/Rust name match |
file.c:line |
main.c:42 |
Source location (requires DWARF) |
Resolution order:
- If
--pidor--uprobe-pidis set, scans/proc/<pid>/mapsfor all mapped executables - Otherwise, scans system libraries via
ldconfigcache and standard paths - For each candidate ELF, reads
.symtaband.dynsymsymbol tables - Demangled matching uses both Rust and C++ demanglers
- Source locations are resolved via gimli
.debug_lineparsing
Multi-attach: If a spec matches multiple symbols (e.g. pthread_* matching 20 functions), uprobes are attached to all of them.
The interactive terminal flamegraph viewer is included by default (forked and adapted from flamelens).
# Interactive TUI with a command
sudo probee --tui --cmd "your-command"

# Live profiling of a running process
sudo probee --tui --pid <pid> --time 30000

# With DWARF unwinding for optimized binaries
sudo probee --tui --dwarf --cmd "./optimized-binary"

# Build without TUI support
cargo build --release --no-default-features
Key Bindings:
| Key | Action |
|---|---|
hjkl / arrows |
Navigate cursor |
Enter |
Zoom into selected frame |
Esc |
Reset zoom |
Tab |
Cycle views: Flamegraph → Top → Processes (→ Output) |
t |
Toggle tree mode (expandable call tree in Top/Processes) |
p |
Toggle PID mode (split flamegraph by process) |
/ |
Search frames with regex |
# |
Highlight selected frame |
n / N |
Next / previous match |
m |
Cycle update mode: Accumulate / Reset / Decay |
z |
Freeze / unfreeze live updates |
q or Ctrl+C |
Quit |
Views:
| View | Description |
|---|---|
| Flamegraph | Interactive flame chart (default) |
| Top | Flat function list sorted by overhead. Press t for expandable call tree. |
| Processes | Process list with CPU% breakdown. Enter to zoom into a process. Press t for tree. |
| Output | Child process stdout/stderr (when using --cmd or --) |
Profile Bee supports two methods for stack unwinding. Both run the actual stack walking in eBPF (kernel space) for performance. Symbolization always happens in userspace.
Uses the kernel's bpf_get_stackid to walk the frame pointer chain. Works out of the box for binaries compiled with frame pointers:
- Rust:
RUSTFLAGS="-Cforce-frame-pointers=yes" - C/C++:
-fno-omit-frame-pointerflag
Handles binaries compiled without frame pointers (the default for most -O2/-O3 builds). Use --dwarf to enable DWARF-based stack unwinding.
How it works:
- At startup, userspace parses
/proc/[pid]/mapsand.eh_framesections from each executable mapping - Pre-evaluates DWARF CFI rules into a flat
UnwindEntrytable (PC → CFA rule + RA rule) - Loads the table into eBPF maps before profiling begins
- At sample time, the eBPF program binary-searches the table and walks the stack using CFA computation +
bpf_probe_read_user - A background thread polls for newly loaded libraries (e.g. via
dlopen) and updates the unwind tables at runtime
This is the same approach used by parca-agent and other production eBPF profilers.
# Enable DWARF unwinding for a no-frame-pointer binary
sudo probee --dwarf --svg output.svg --time 5000 -- ./my-optimized-binary

# Frame pointer unwinding (the default)
sudo probee --svg output.svg --time 5000 -- ./my-fp-binaryNote: For symbol resolution, you still need debug information:
- Rust: Add
-gflag when compiling - C/C++: Compile with debug symbols (
-gflag)
Limitations: Max 8 executable mappings per process, 131K unwind table entries per binary (up to 64 binaries), up to 165 frame depth (via tail-call chaining; legacy fallback: 21 frames). x86_64 only. Libraries loaded via dlopen are detected within ~1 second.
See docs/dwarf_unwinding_design.md for architecture details, and Polar Signals' article on profiling without frame pointers for background.
Upload profiles directly to AWS CodeGuru Profiler for continuous profiling with anomaly detection and optimization recommendations.
# One-time setup: create a profiling group
aws codeguruprofiler create-profiling-group \
  --profiling-group-name my-app \
  --compute-platform Default

# Profile and upload directly (use sudo -E to preserve AWS credentials)
sudo -E probee --codeguru-upload --profiling-group my-app --time 10000

# Off-CPU profiling uploads as WAITING counter type (visible in Latency view)
sudo -E probee --codeguru-upload --profiling-group my-app --off-cpu --time 10000

# Save a local copy while uploading
sudo -E probee --codeguru-upload --profiling-group my-app --codeguru local.json --time 10000

# Or generate the JSON locally and upload separately via AWS CLI
sudo probee --codeguru profile.json --time 10000
aws codeguruprofiler post-agent-profile \
  --profiling-group-name my-app \
  --agent-profile fileb://profile.json \
  --content-type application/json
Uses the standard AWS credential chain (environment variables, ~/.aws/credentials, IAM role, IMDS). When running with sudo, use sudo -E to preserve environment variables.
On-CPU samples use RUNNABLE counter type (visible in CPU and Latency views). Off-CPU samples use WAITING (visible in Latency view only). See docs/codeguru_format.md for format details.
The --pprof flag outputs gzip-compressed pprof protobuf, the standard interchange format for profiling data:
sudo probee --pprof profile.pb.gz --time 5000

# View with go tool pprof
go tool pprof -http :8080 profile.pb.gz

# Upload to Grafana Cloud Profiles, Pyroscope, Datadog, or Polar Signals
Compatible with: go tool pprof, Grafana/Pyroscope, Speedscope, Datadog Continuous Profiler, Polar Signals/Parca.
# Build without AWS SDK (smaller binary, fewer dependencies)
cargo build --release --no-default-features --features tuiProfile Bee can be used as a Rust library (not just a CLI). The ProfilingSession API consolidates eBPF loading, DWARF setup, and the event loop into a single entry point.
When building a custom profiling agent, you often need per-process context (command line, environment variables, working directory) to enrich stack traces. The ProcessMetadataCache provides a lazy, capacity-bounded cache backed by /proc/[pid]/:
use profile_bee::process_metadata::ProcessMetadataCache;

let mut cache = ProcessMetadataCache::new(1024);

// Lazily loads from /proc on first access
if let Some(meta) = cache.get_or_load(pid) {
    println!("exe: {:?}", meta.exe);
    println!("cwd: {:?}", meta.cwd);

    // Read a specific environment variable
    if let Some(val) = meta.environ_var("APOLLO_GRAPH_REF") {
        println!("graph ref: {}", val);
    }
}

// Shorthand for get_or_load + environ_var
let db_url = cache.environ_var(pid, "DATABASE_URL");
The cache integrates with eBPF lifecycle events: exec events invalidate entries (same PID, new binary), exit events remove them. PID reuse is detected via /proc/[pid]/stat starttime comparison.
Enable SessionConfig::track_process_lifecycle to receive eBPF-driven exec and exit events. This is auto-enabled when DWARF unwinding is active (unwind tables need to be reloaded on exec). Custom agents should enable it for metadata cache management:
use profile_bee::session::{SessionConfig, ProfilingSession};
use profile_bee::ebpf::ProfilerConfig;

let config = SessionConfig {
    track_process_lifecycle: true,
    profiler: ProfilerConfig::default(),
    ..Default::default()
};

let session = ProfilingSession::new(config).await?;
// The event loop automatically handles exec (cache invalidation, DWARF reload)
// and exit (deferred eviction) events.
// Access the metadata cache via session's event loop:
// event_loop.process_metadata().get_or_load(pid)- Linux only (requires eBPF support)
- DWARF unwinding: x86_64 only, see limits above
- Interpreted / JIT stack traces not yet supported
- VDSO
.eh_frameparsed for DWARF unwinding; VDSO symbolization not yet supported
- Install stable and nightly Rust:
rustup install stable nightly - Install bpf-linker:
cargo install bpf-linker
# Build eBPF program (requires nightly)
cargo xtask build-ebpf

# Build userspace (uses fresh eBPF build if available, otherwise prebuilt)
cargo build --release

# Run
cargo xtask run
To perform a release build of the eBPF program, use cargo xtask build-ebpf --release. You may also change the target architecture with the --target flag.
More documentation in the docs directory.
- perf + Cargo flamegraph
- BCC profile
- parca-agent — always-on eBPF profiling in Go