Daisy Rivera:
To help the retailer understand the properties of products and outlets that play crucial roles in increasing sales.
Link to original dataset
This dataset had a total of 8523 rows and 12 columns of information. There were a total 5 numeric columns and 7 categorical columns.
- The data had 2 columns with missing items.
- There was a column with inconsistent categories misspellings.
- One of the columns was an Ordinal and had to changed to numerical.
- Inconsistent categories were fixed
- Ordinal column was assigned numberic values
- Features and Target Values were assigned. In this case Item_Outlet_Sales was our Target.
- The data was split into a training and testing dataset using the default 75/25 split.
- Created a processor to include 2 Pipelines(one for categorical columns and one for numeric columns)
- For categorical columns:
- Addressed missing items using a constant SimpleImputer
- Converted categorical columns into numeric by using the OneHotEncoder
- For numeric columns:
- Addressed missing items usnig a mean SimpleImputer
- Scaled all numeric columns
- Created 2 Machine Learning models
- Linear Regression Model
- Decision Tree Model

- Comparing the sales by Item and their fat content, we can see that the sales of certain items are clearly influenced by whether they are low fat or regular. An observation I see is that items which tend to have high levels of sugars such as snacks, drinks and breakfast are the items that sell more low fat content.
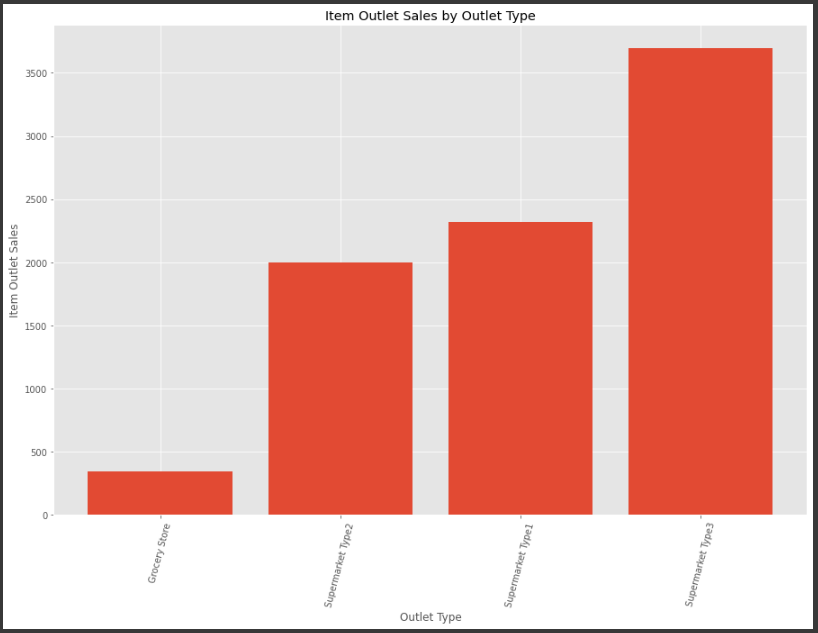
- SupermarketType3 clearly has the most sales. It would be useful to understand more what the differences are between the different types of supermarket outlets to disect further why these outlets are selling more on average than its counterparts.

- These are the features that our model used the most.

- All of my coefficients were categorical items. The 3 largest coefficients I have are: OUtlet_Size_Medium, Outlet_Identifier_OUT019 and Outlet_Type_Supermarket Type3. Belonging to these categories will have the following changes to the target:
- Outlet_Size_Medium : 33577528470196481
- Outlet_Identifier_OUT019 : 3137133190522628
- Outlet_Type_Supermarket Type3 : (-3068332354615559.5)

- Comparing the feature importances to the shap values above, I show that I have the same exact Top 5 features only in different orders. The Item_MRP is the biggest contributor to the predictions by far. Also, the Outlet_Type_Supermarket Type1 is the 5th feature on both graphs.

- The Shap Summary above shows that our 3 most important features are Item_MRP, Outlet_Type_Supermarket Type3 and Outlet_Identifier_OUT010.
- Item_MRP had the largest effect on the model's predictions. This is an integer feature so looking at the graph I can see that the higher the Item_MRP was, the more positively higher the predicted price was. The lower the Item_MRP was the more negatively lower the predicted sales were.
- Outlet_Type_Supermarket Type3 was a categorical feature. Based on the graph above when this category was selected it had a high positive impact on the overall sales.
- Outlet_Identifier_OUT010 was also a cetgorical feature. This feature however, had a negative impact on the overall sales the more it was selected.


- The plots above show a single example of a random sales prediction. I chose to evaluate a random sample from Supermarket Type3 since this Supermarket has the highest average sales. We can see that this sample was impacted positively by the Outlet_Type_Supermarket Type3 however, the Item_MPR impacted the sale negatively. This random item happened to be a fruit and vegetable item which may be why it's price was low. This sale falls below the base value of 2154.


- The plots above show a single random sales prediction for a starchy food item. I chose to evaluate a starchy food item since this item had the highest average sales. We can see from above the plots that the sale prediction was significantly impacted positively by the Outlet_Type_Supermarket Type3, Item_MRP, Outlet_Identifier_OUT019 and Outlet_Identifier_OUT010. This sale prediction is way above the base value of 2154.
- Comparing both the Decision Tree and Linear Regression models, the Decision Tree Model performed better overall. I utilized various regression metrics to evaluate and compare both models and the Decision Tree model had better results predicting future sales prices.
For any additional questions, please contact daisy.dinny@hotmail.com